Heat Map Analytics
See Your Data Come to Life with Heat Maps
Transform your Amazon data into interactive heat maps that reveal geographic patterns instantly. Compare total sales and normalized performance across regions and time.
- Sales Heat Maps
- Visualize sales across months or products to quickly spot high-performing periods. Refine your strategy based on discovered patterns.
- Time-Based Patterns
- See when customers buy most to optimize inventory and promotions. Identify peak sales windows and seasonal trends.
- Product Performance
- Compare top-performing and underperforming products at a glance. Surface product trends quickly to guide growth decisions.
Visual Insights
Stop Drowning in Spreadsheets
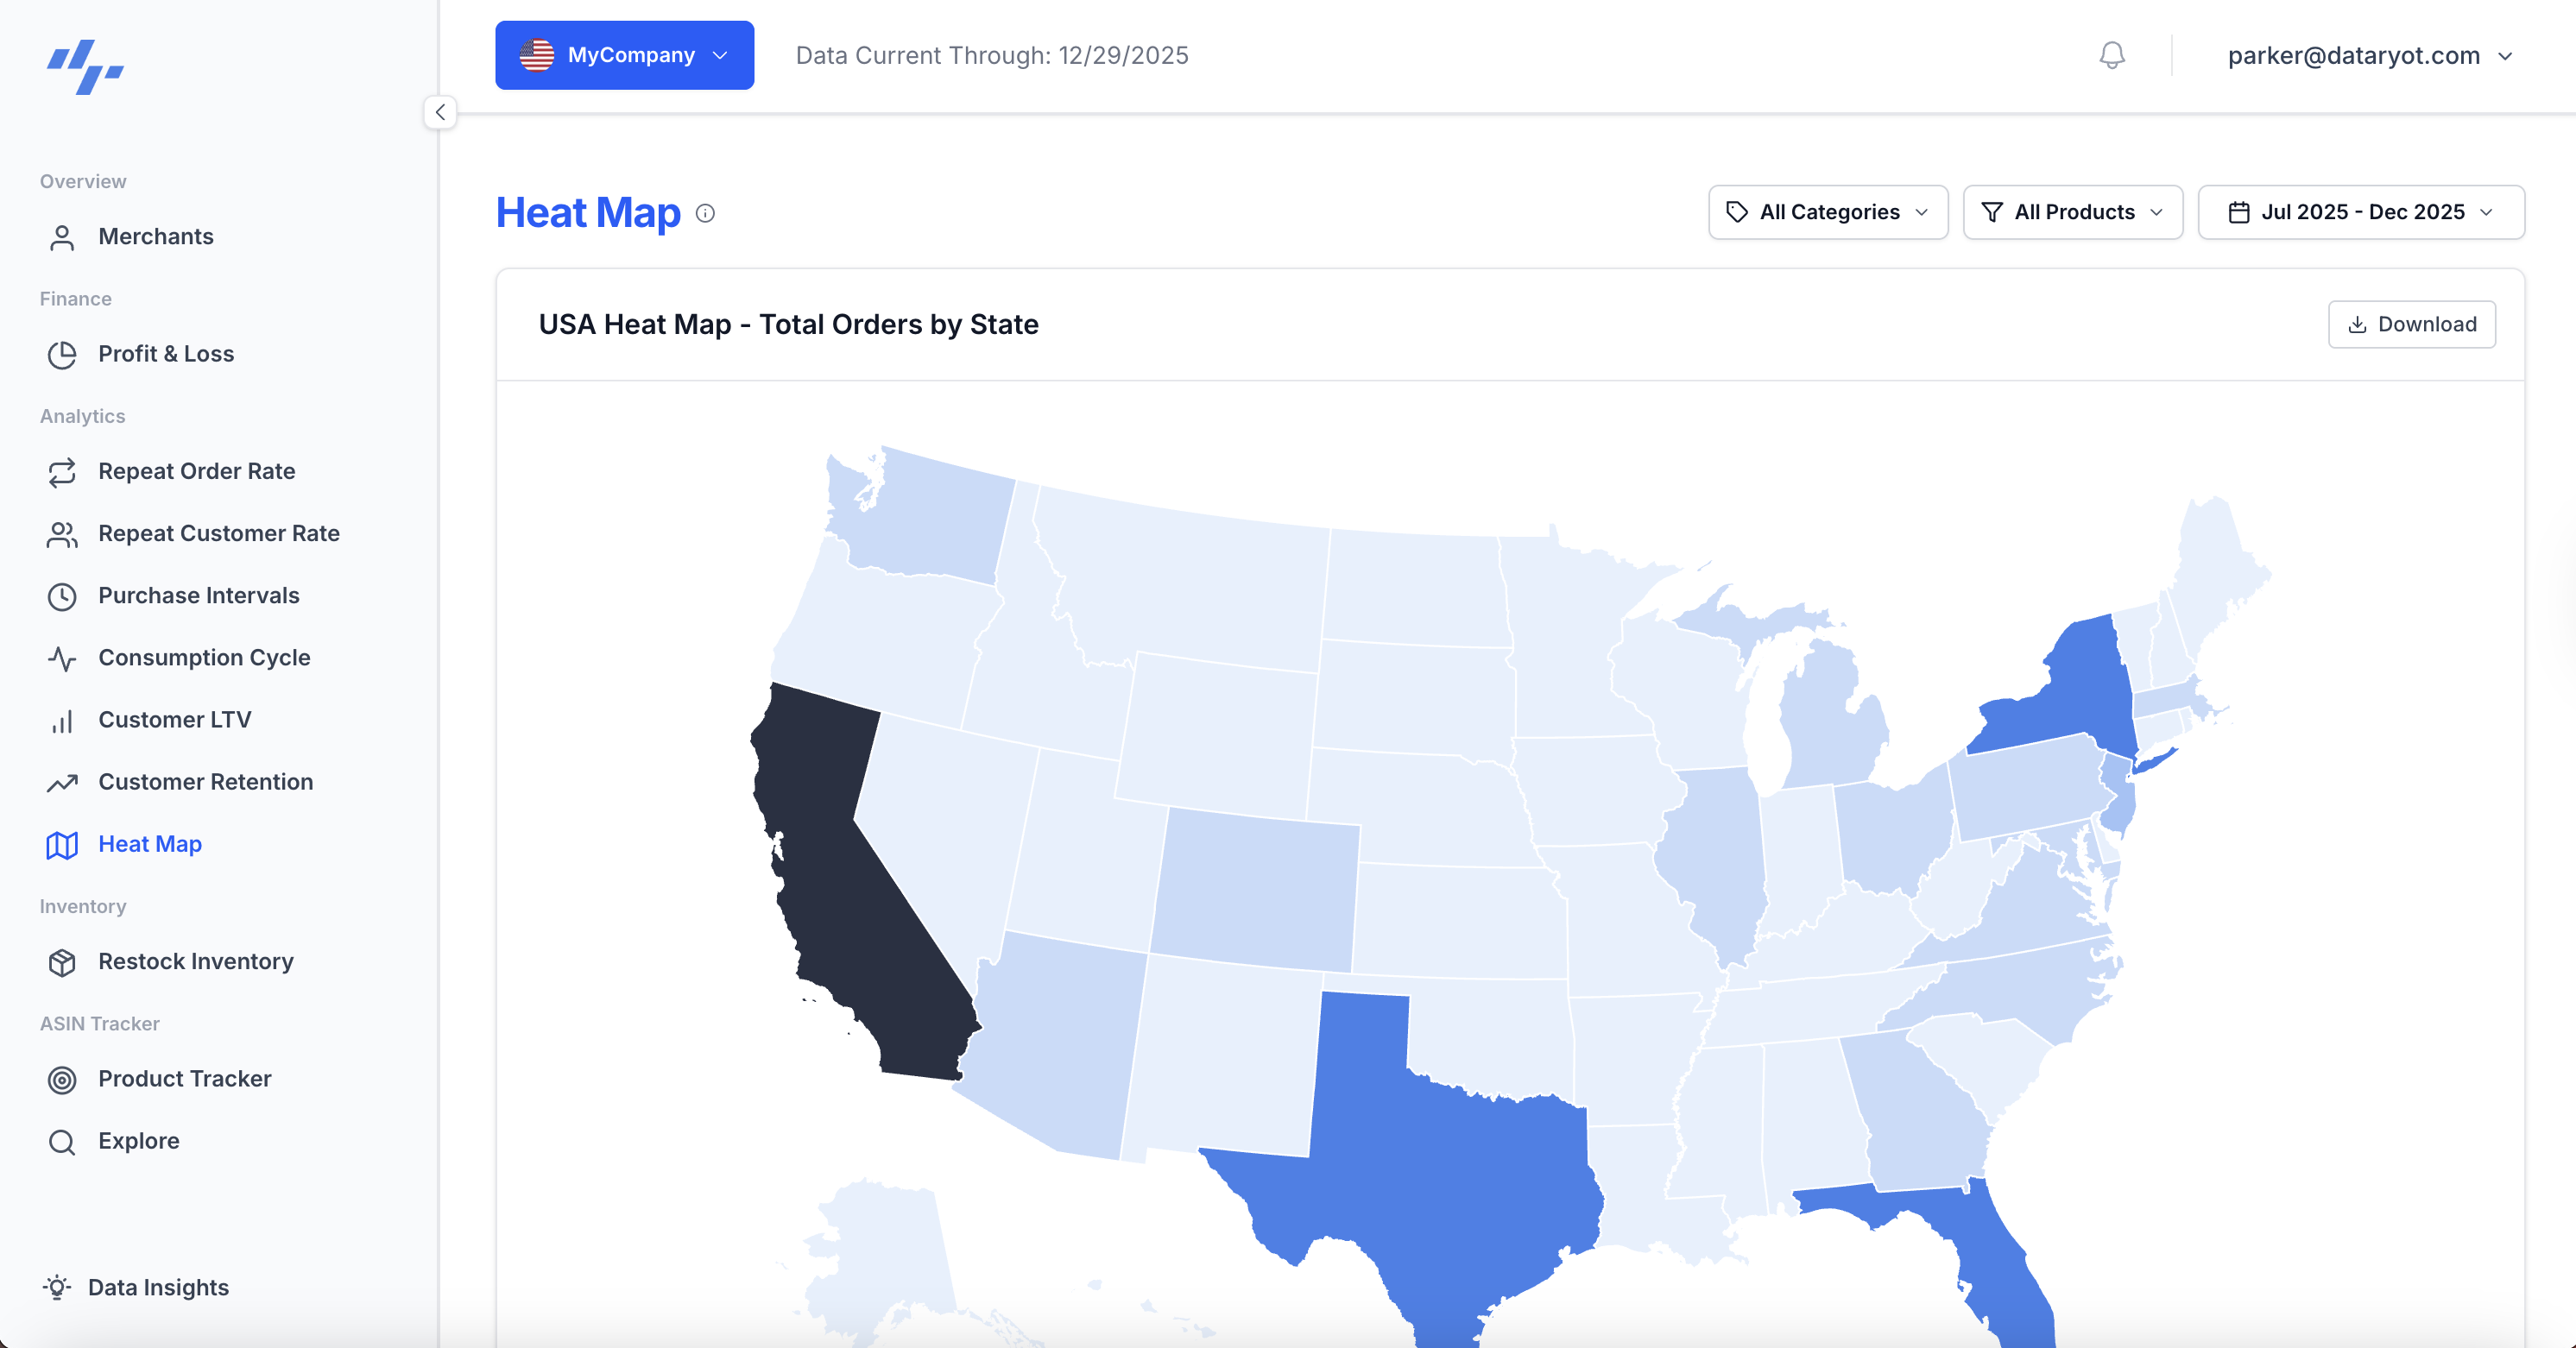
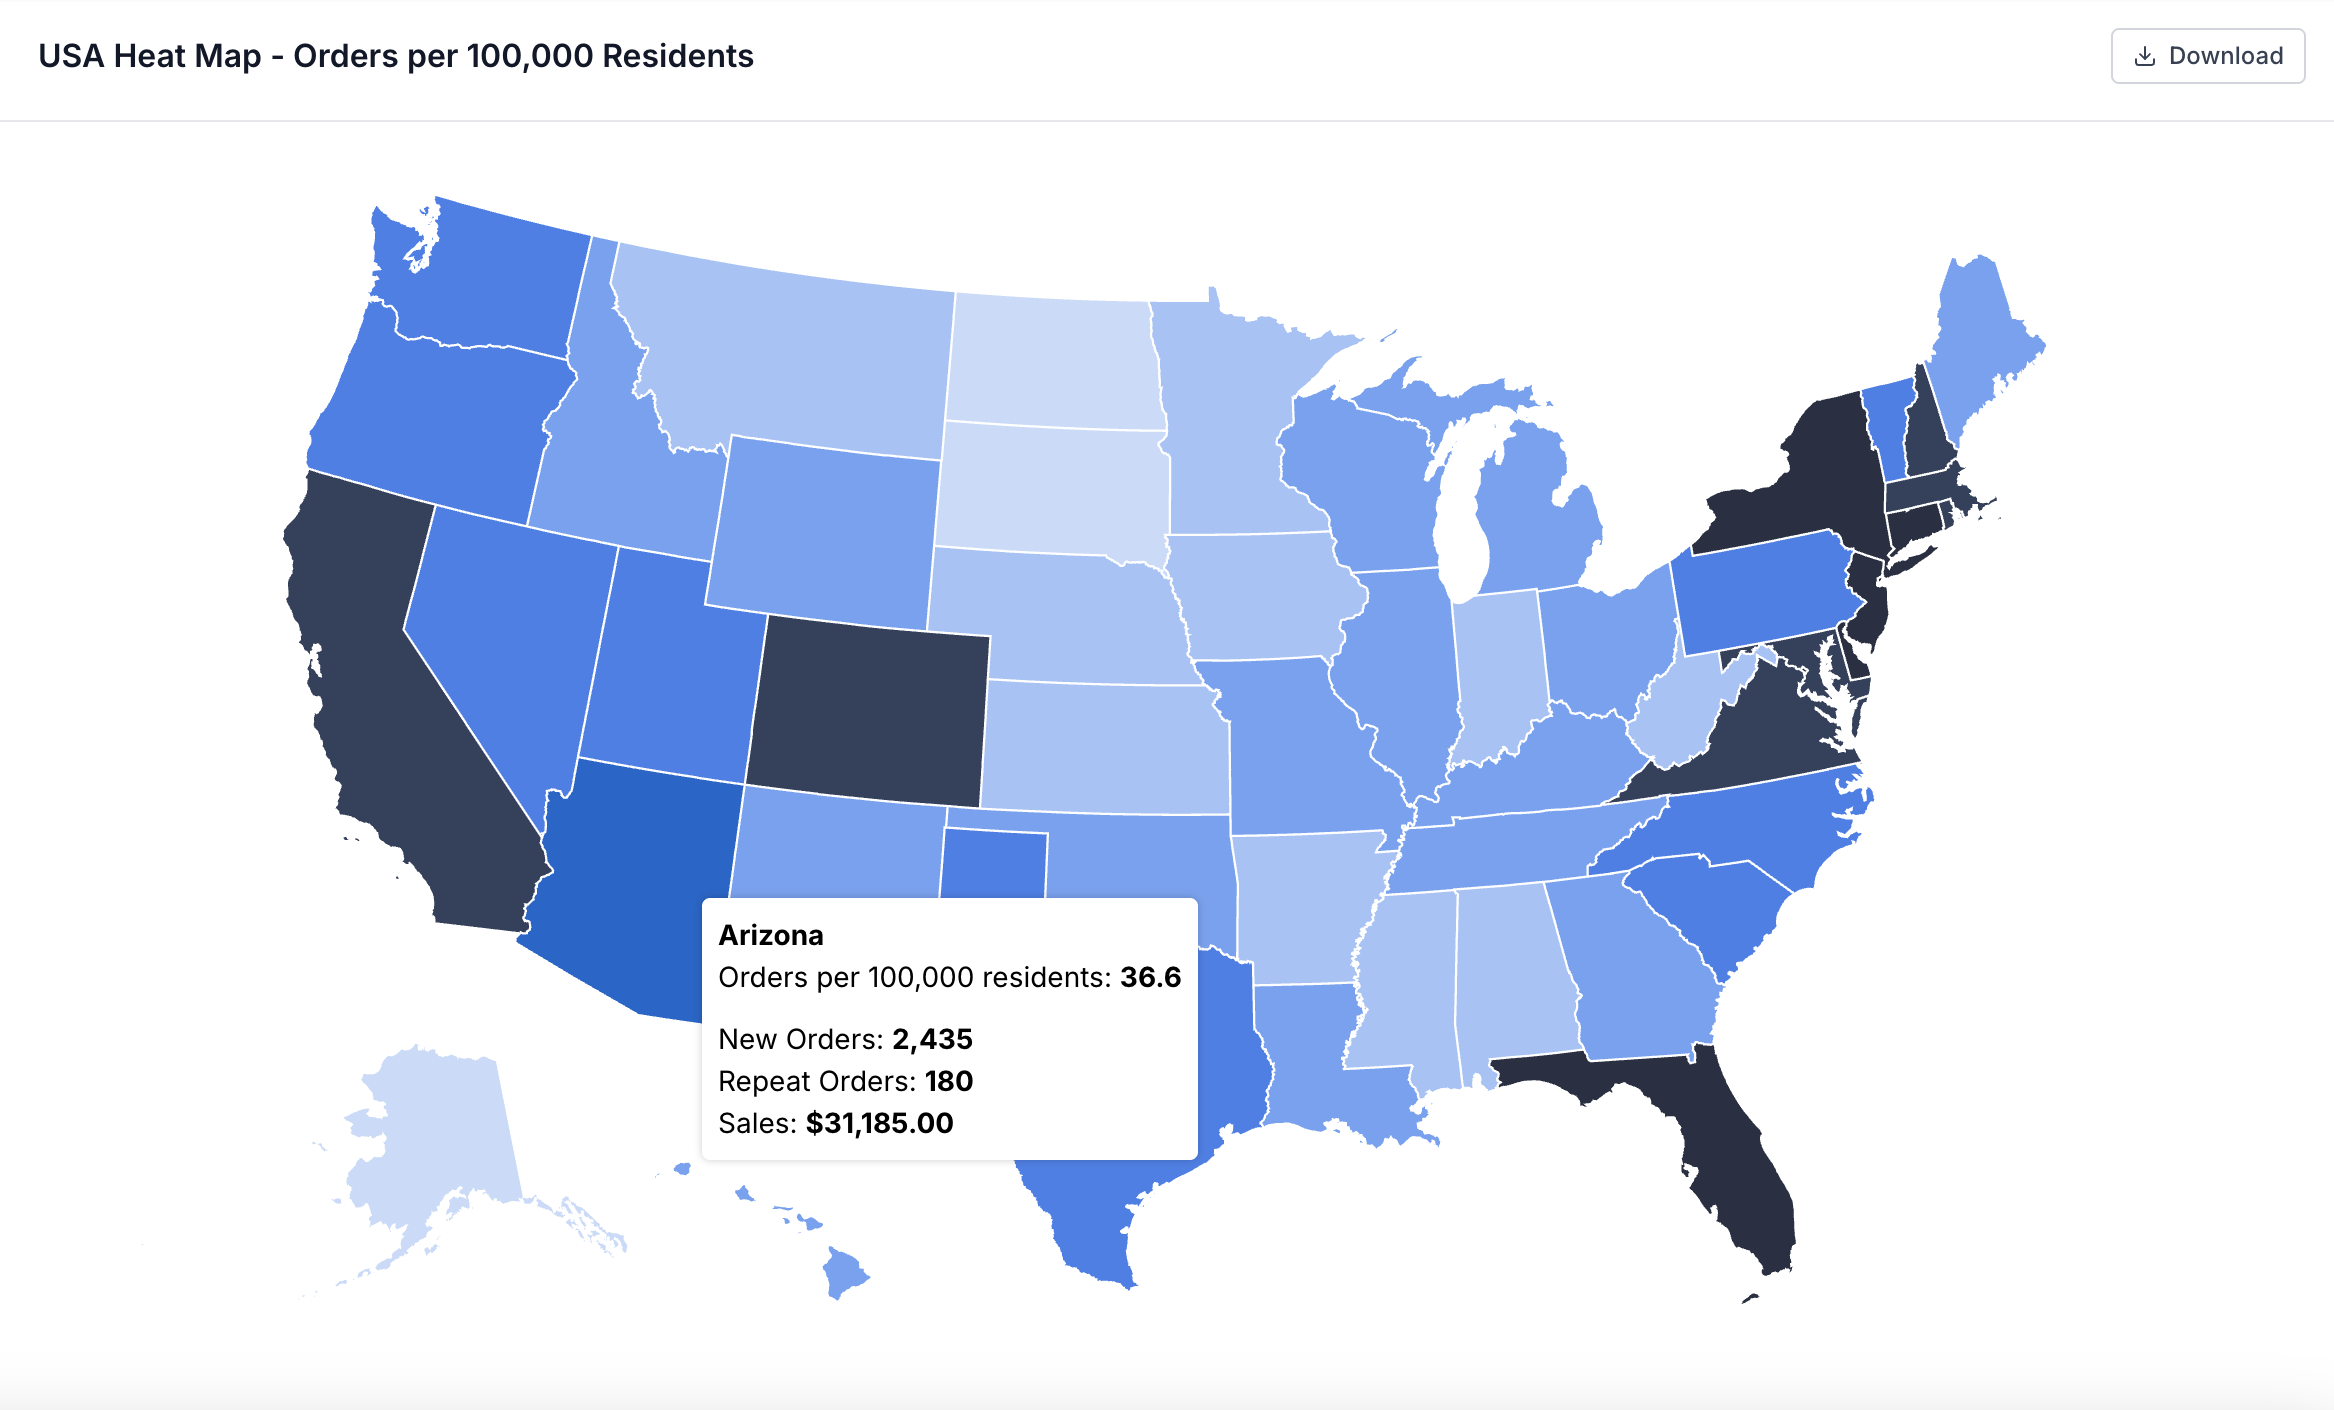
Amazon data is hard to interpret in rows and columns. dataryot turns your sales data into interactive heat maps that surface geographic and time-based patterns instantly. Visualize sales by state, reveal seasonal patterns across months, and filter by product to compare performance across regions.
How to Use Heat Map Analytics
Turn visual patterns into confident business decisions
- Optimize Promotion Timing
Use sales heat maps to identify your best time periods. Schedule campaigns and promotions to align with higher demand windows.
- Plan Inventory with Confidence
Spot seasonal patterns and predict demand spikes. Stock up before peak periods and avoid overstocking during slow windows.
- Identify Product Opportunities
Compare product performance across states and time periods. See where products perform best to guide targeted marketing.
Frequently Asked Questions
What is a heat map for Amazon sellers?
A heat map visualizes your sales, customer activity, or product performance data using color intensity. It helps you quickly identify patterns, trends, and opportunities in your Amazon business.
How can heat maps help my Amazon business?
Heat maps help you identify peak sales times, top-performing products, high-value customer segments, and seasonal trends at a glance. They make complex data easy to understand and act on.
What types of heat maps does dataryot provide?
dataryot provides heat maps for sales and product performance across geographic regions and time periods. All heat maps are interactive and update in real-time.
How do I use heat map insights?
Use heat maps to optimize inventory timing, schedule promotions during peak periods, identify top products to promote, and understand customer behavior patterns.
Start using heat map analytics today
Start your 7-day free trial and see your data come to life.