Repeat Order Rate
See How Repeat Orders Drive Your Business
Track company-wide repeat order rate and product-level reorder behavior—so you know how loyal customers are overall and which SKUs drive repeat purchases.
- Repeat vs New Orders
- See the split between repeat and new orders at a glance. Instantly understand how much revenue comes from returning customers.
- Product-Level Analysis
- Compare repeat vs new orders by product to see which ASINs drive repeat business and long-term customer value.
- Monthly Breakdown
- View monthly repeat order rates by product to spot trends, seasonality, and changes in customer behavior over time.
Order-Level Tracking
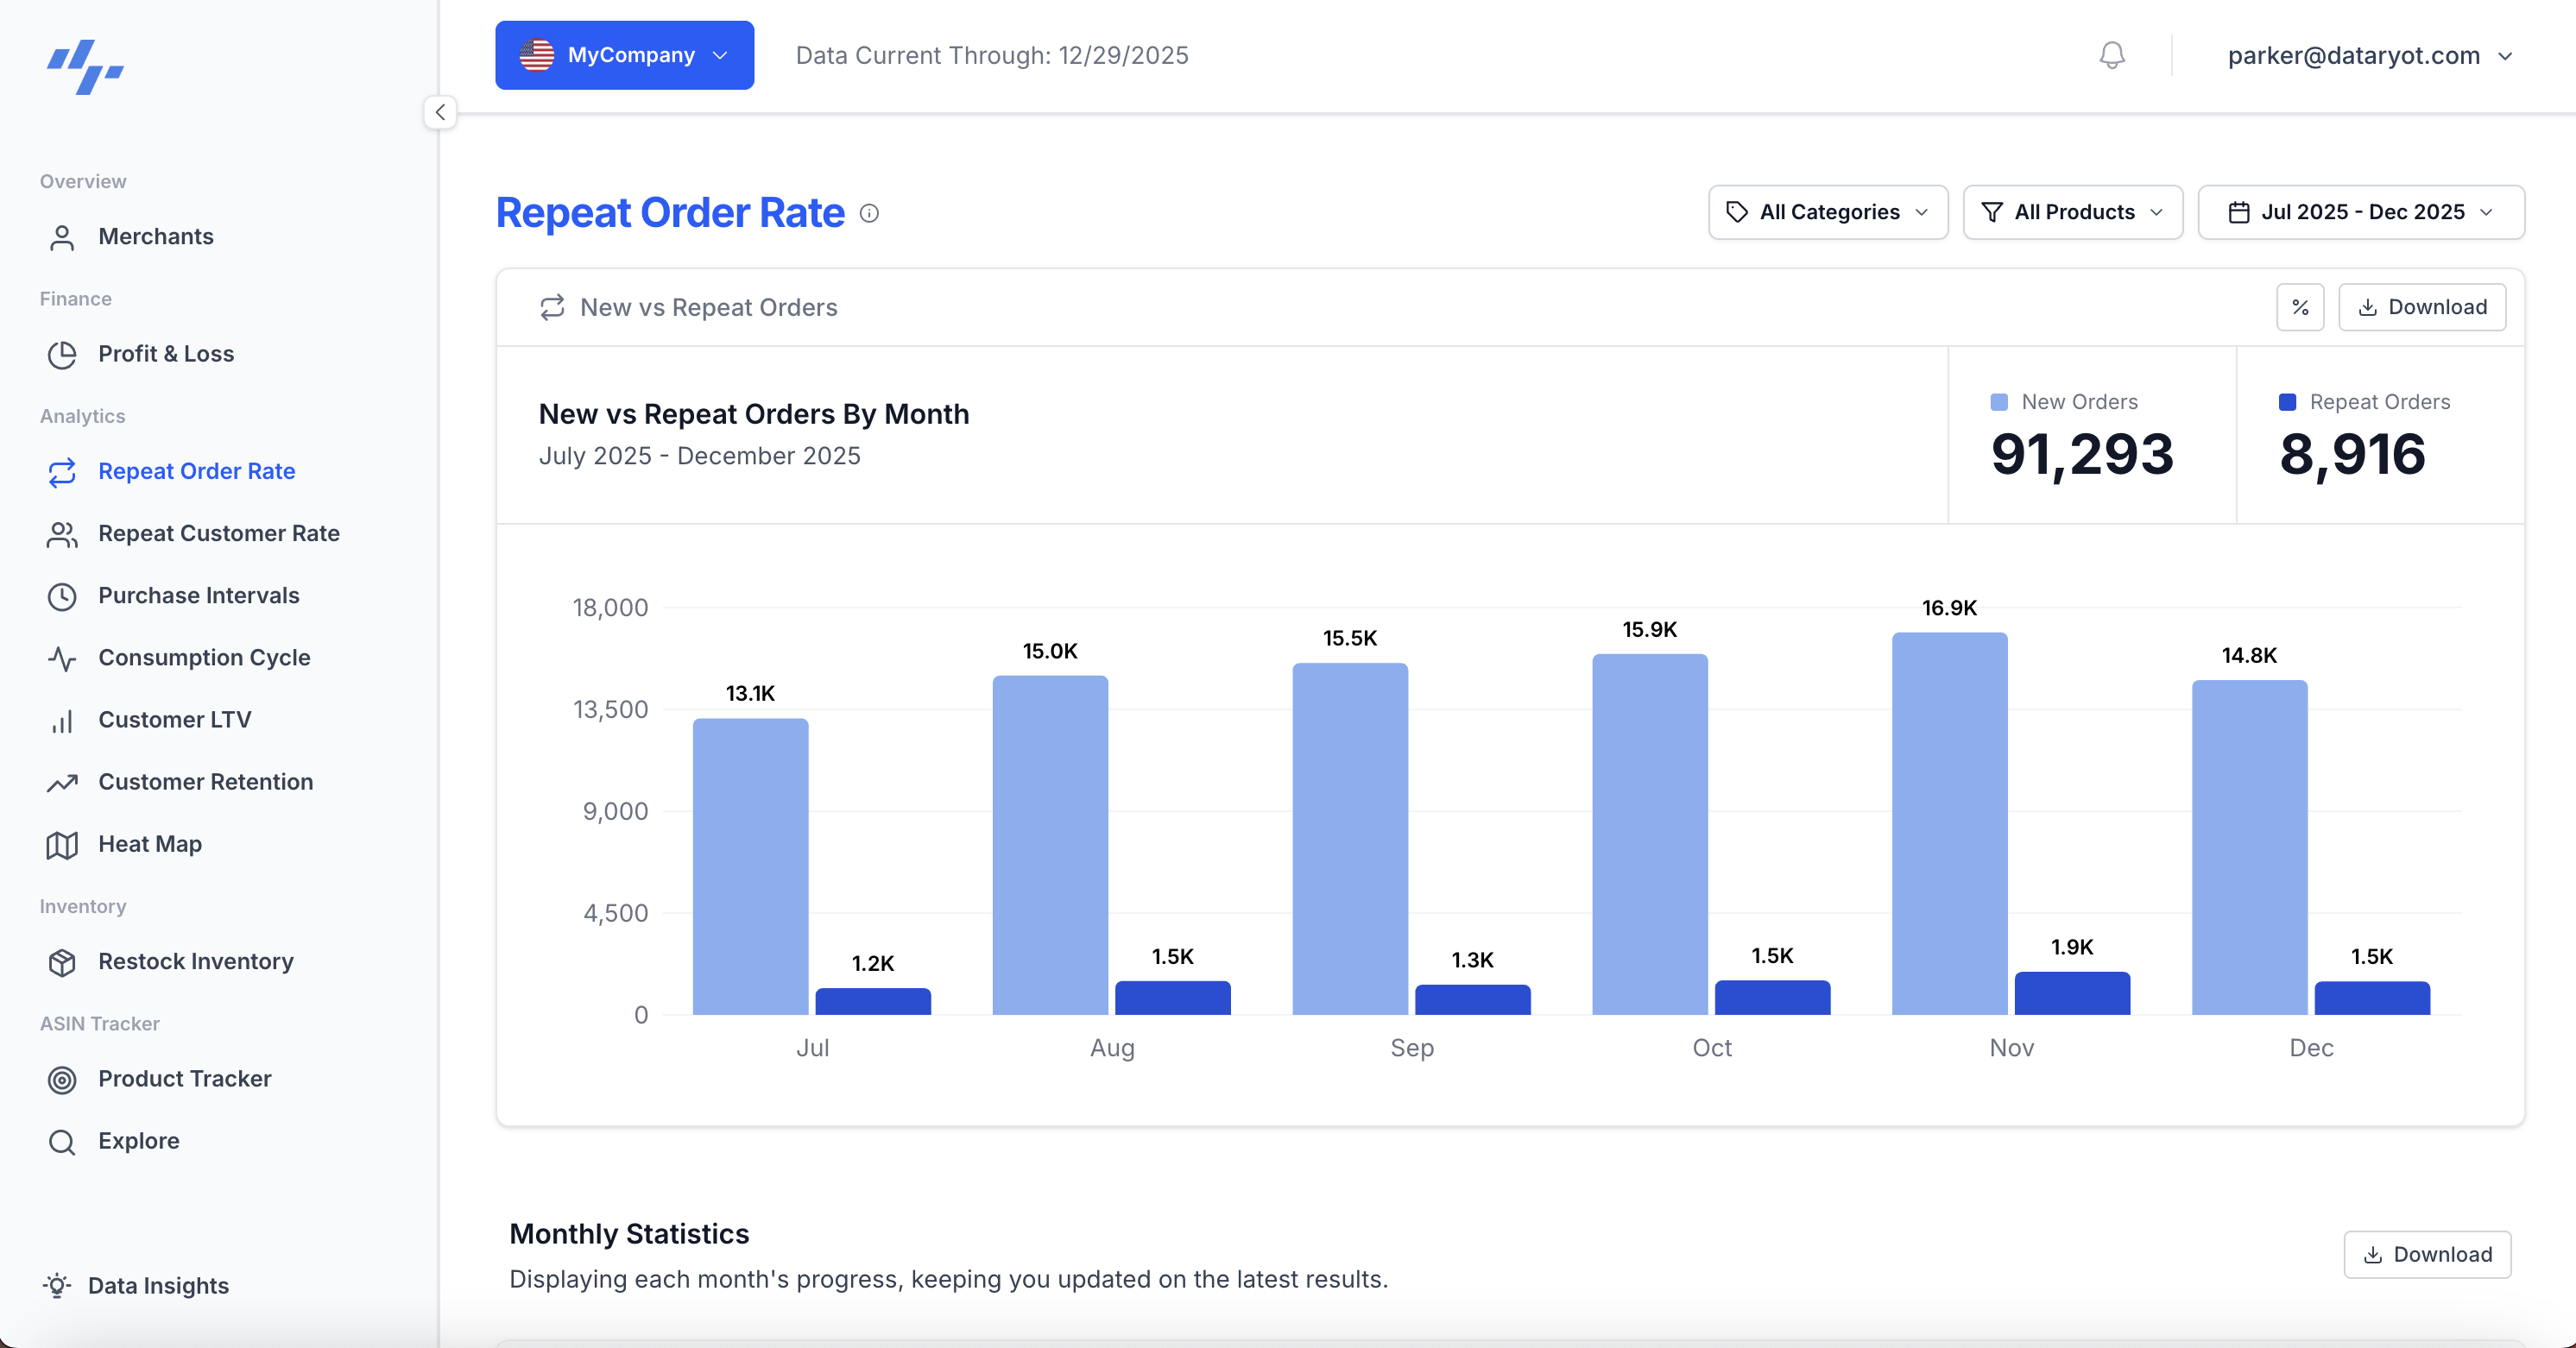
New vs Repeat Orders
See the overall breakdown of new vs repeat orders. Repeat Order Rate shows the percentage of your orders that come from returning customers, helping you understand how much of your revenue is driven by repeat business.
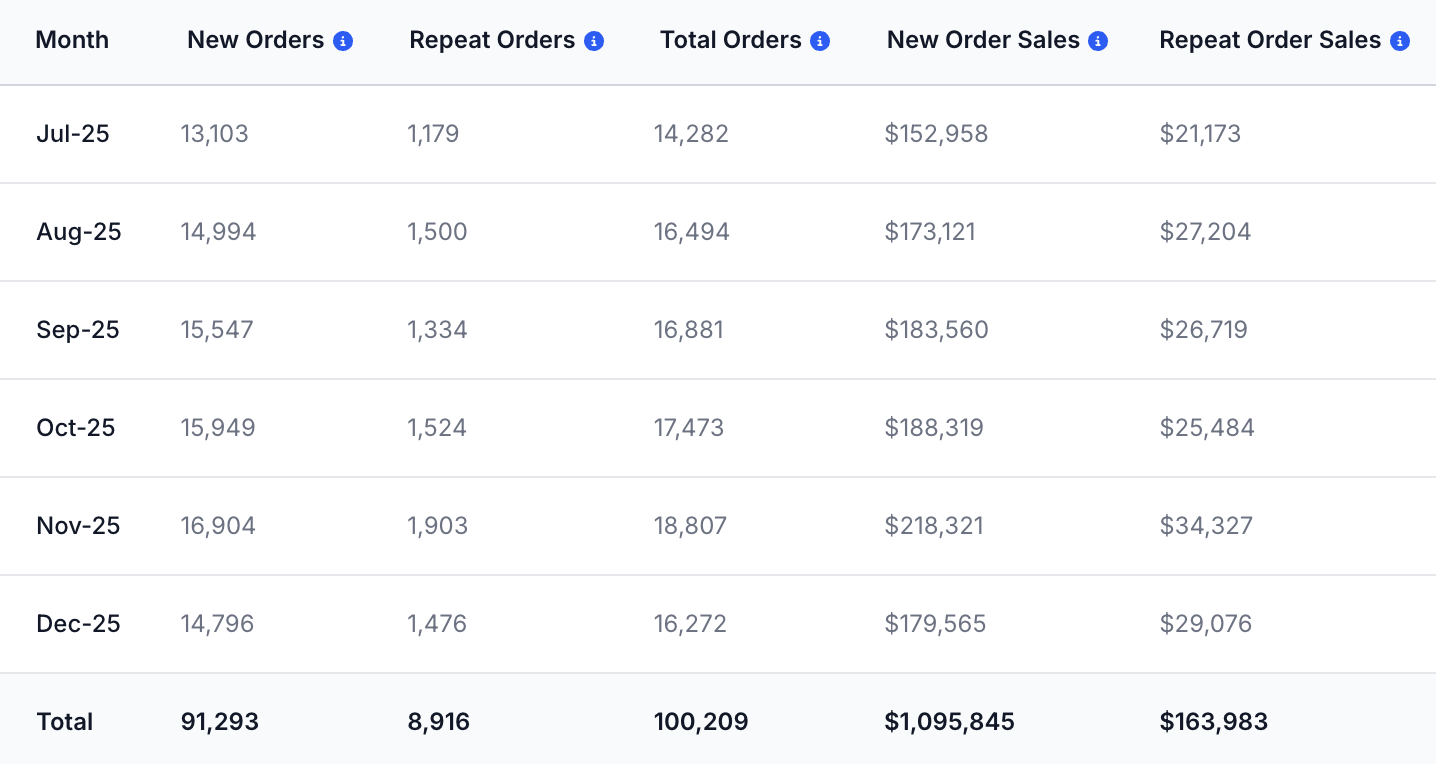
Monthly Statistics
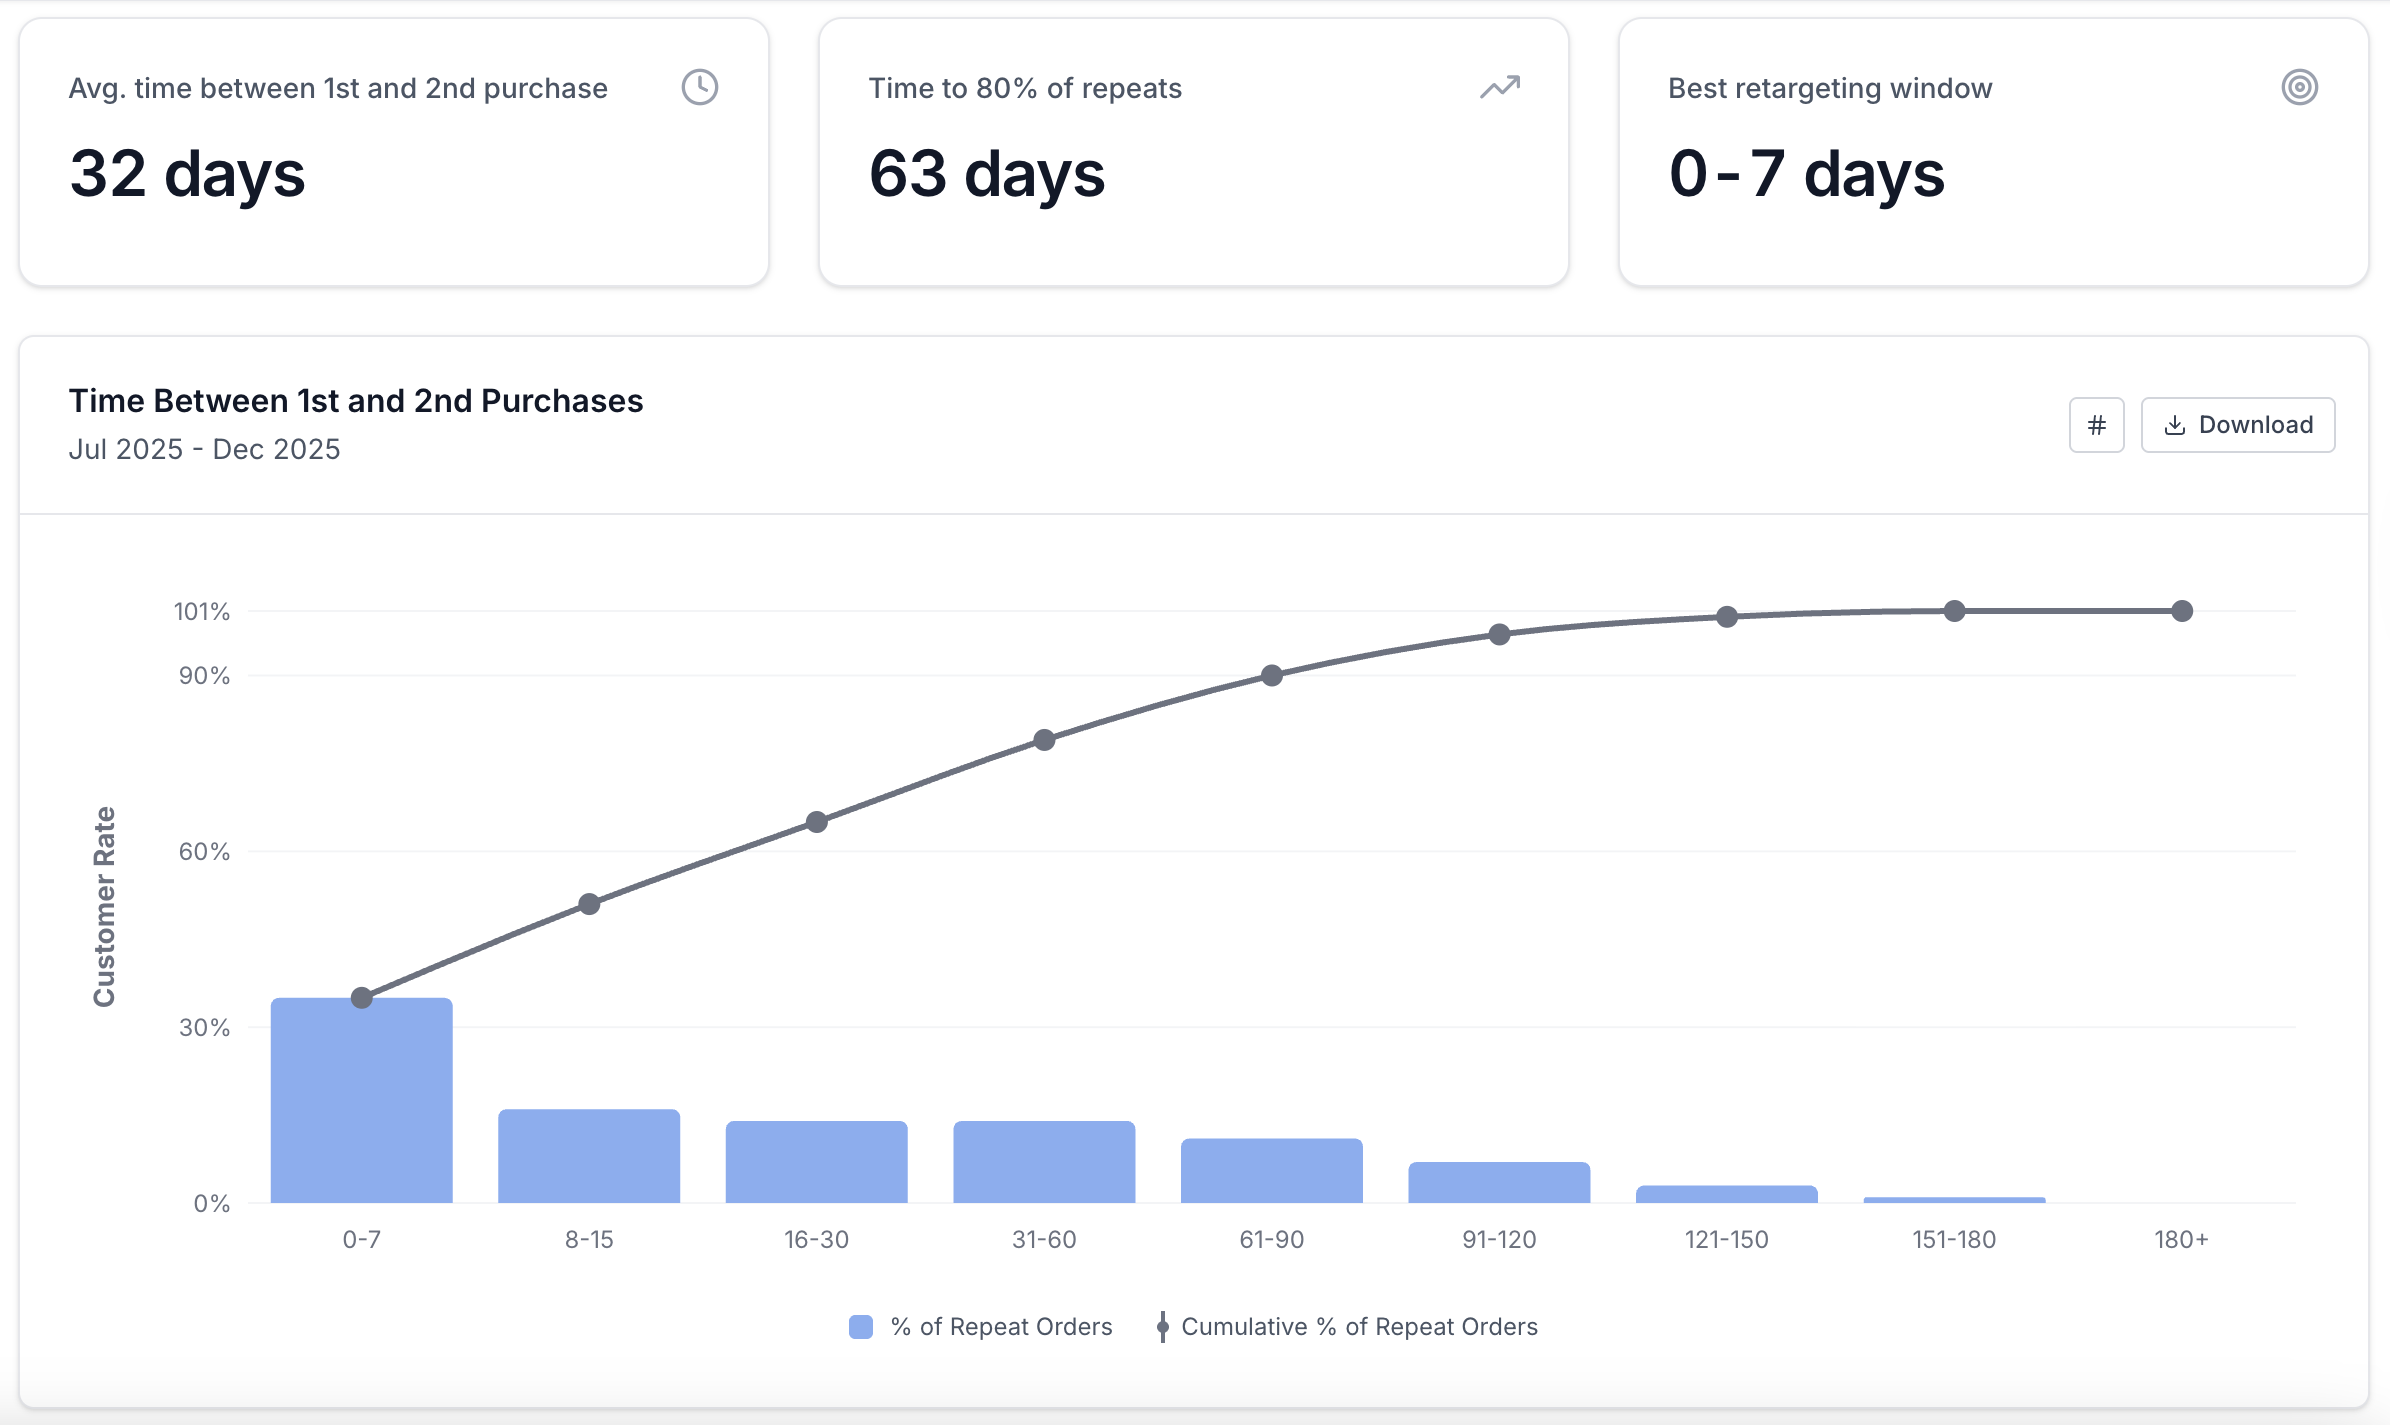
Monthly Repeat Order Breakdown
Track how repeat order rates change month by month and view them alongside sales performance. Understand seasonality, spot improving or declining products, and see how repeat behavior impacts revenue over time.
Sales Performance
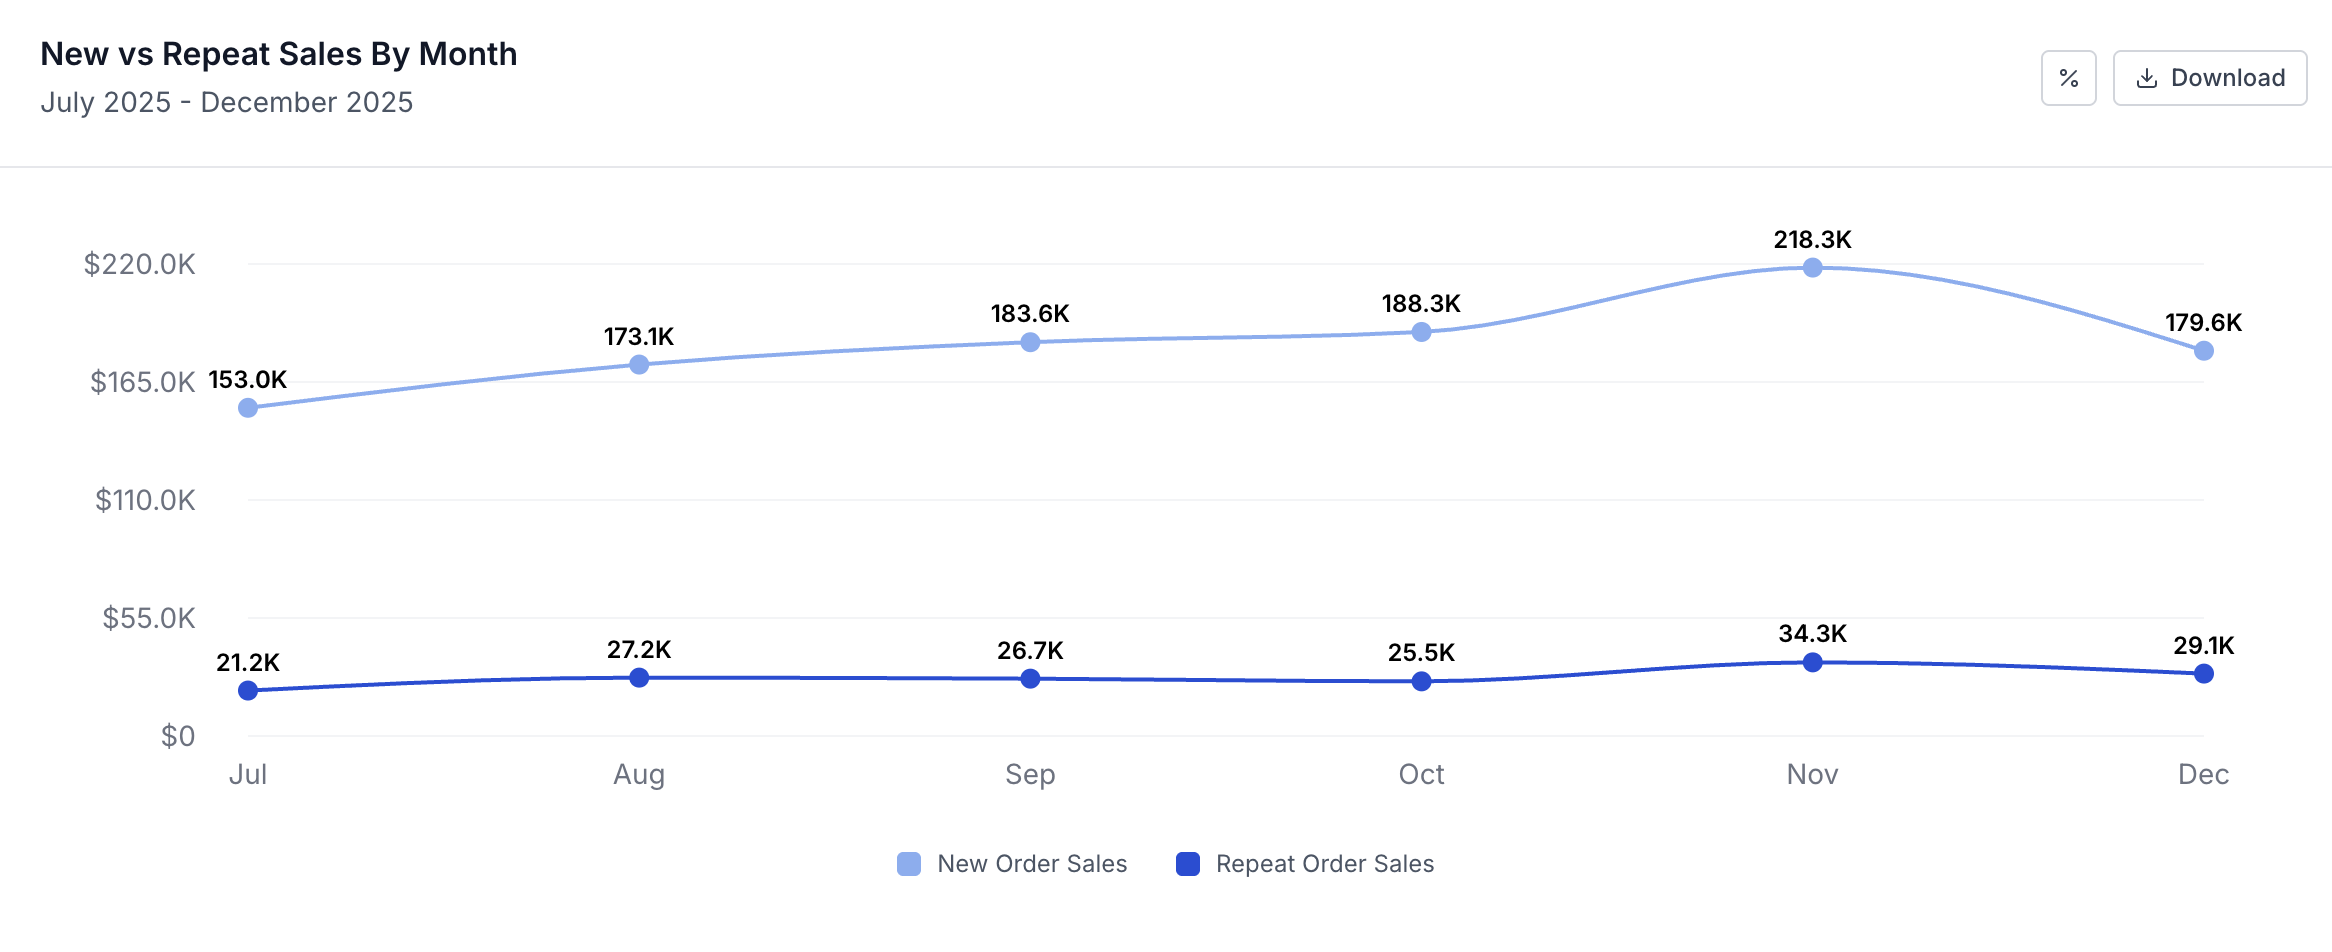
New vs Repeat Sales
Compare new and repeat order sales over time to see how returning customers contribute to revenue. Track changes in repeat sales momentum and understand how customer loyalty impacts monthly performance.
Key Insights
Refine your product strategy with repeat order rate data
- Product Prioritization
Not all products drive repeat orders. Identify which products create returning customers and focus your inventory, marketing, and product decisions on those winners.
- Sustainable Revenue
Products with strong repeat order rates generate predictable, recurring revenue. Prioritize expanding these product lines instead of relying on constant new product launches.
- Category Optimization
Compare repeat order rates across categories to refine your product mix. Double down on categories that create loyal customers and long-term value.
Frequently Asked Questions
What is repeat order rate?
Repeat order rate measures the percentage of orders that are repeat purchases. It's calculated by dividing repeat orders by total orders and multiplying by 100. This metric focuses on order-level data rather than customer-level data.
How is repeat order rate different from repeat purchase rate?
Repeat order rate focuses on orders (transactions), while repeat purchase rate focuses on customers. A customer might place many repeat orders, affecting each metric differently. Repeat order rate shows what percentage of your orders come from repeat buyers.
What's a good repeat order rate for Amazon?
A good repeat order rate varies by category. For consumables, aim for 30-40% or higher. For durable goods, 10-20% is typical. dataryot shows benchmarks for your specific category and helps you understand where you stand.
How can I improve my repeat order rate?
Focus on product quality, competitive pricing, excellent customer service, and consider bundling or subscription options. Track which products have high repeat order rates and expand those lines. Use Amazon Subscribe & Save for consumable products.
Why should I track repeat order rate by product?
Not all products drive repeat orders equally. By tracking repeat order rate at the product level, you can identify which items create loyal customers and focus your inventory, marketing, and product development efforts on winners.
Start tracking repeat order rate today
See which products drive repeat orders and optimize your customer loyalty.